


Running a school is complicated, our product shouldn’t be. Our goal was to change how assessments are managed in Irish schools forever.
Assessments is one of the biggest features in the vsware system. It includes in-class tests, term report and Junior/Leaving certificate exams. Before, the information architecture of the system was confusing and overwhelming. We decided to separate the assessment feature and combine them into one place so everything can be easily found. The assessment dashboard was created to give assessments a new home.
The Narnia approach was a temporary solution to implementing our designs in with the old designs. It basically works like the closet in Narnia. Passing through the closet will lead to a completely different looking world. This is how the assessments feature will work until the rest of the features in VSware are updated. This meant that there was less bugs for the developers and it wouldn’t overwhelm our users. Teachers can be very passionate about change, even if it’s just a colour change of a button. This approach allowed our users to ease into the new designs.
The pandemic was a stressful and busy time for schools across Ireland. It became more difficult for principals and teachers to give us time for feedback. Along came Maze.co - a rapid, remote testing tool for agile teams. This allowed us to test our designs anywhere at anytime. It sped up the process and it allowed us to test on more users. It was a great success as the participants could do the test in their own time, inside or outside the busy classroom.
Heats maps are a great tool for understanding how our users interact with the designs. Maze analyses the optimal path navigation, bounce and usability for each screen.
Maze provides success metrics so we can understand where and when the users dropped-off during the task. The higher the percentage, the more likely our users are understanding can understand how the product works.
We received great ideas for new features in assessments. One of them was Target Grade, a tool that allows student to input their target grade for each subject at the beginning of the year. Teachers can compare this grade with their current average grade to see if they are on course to achieving their goal.
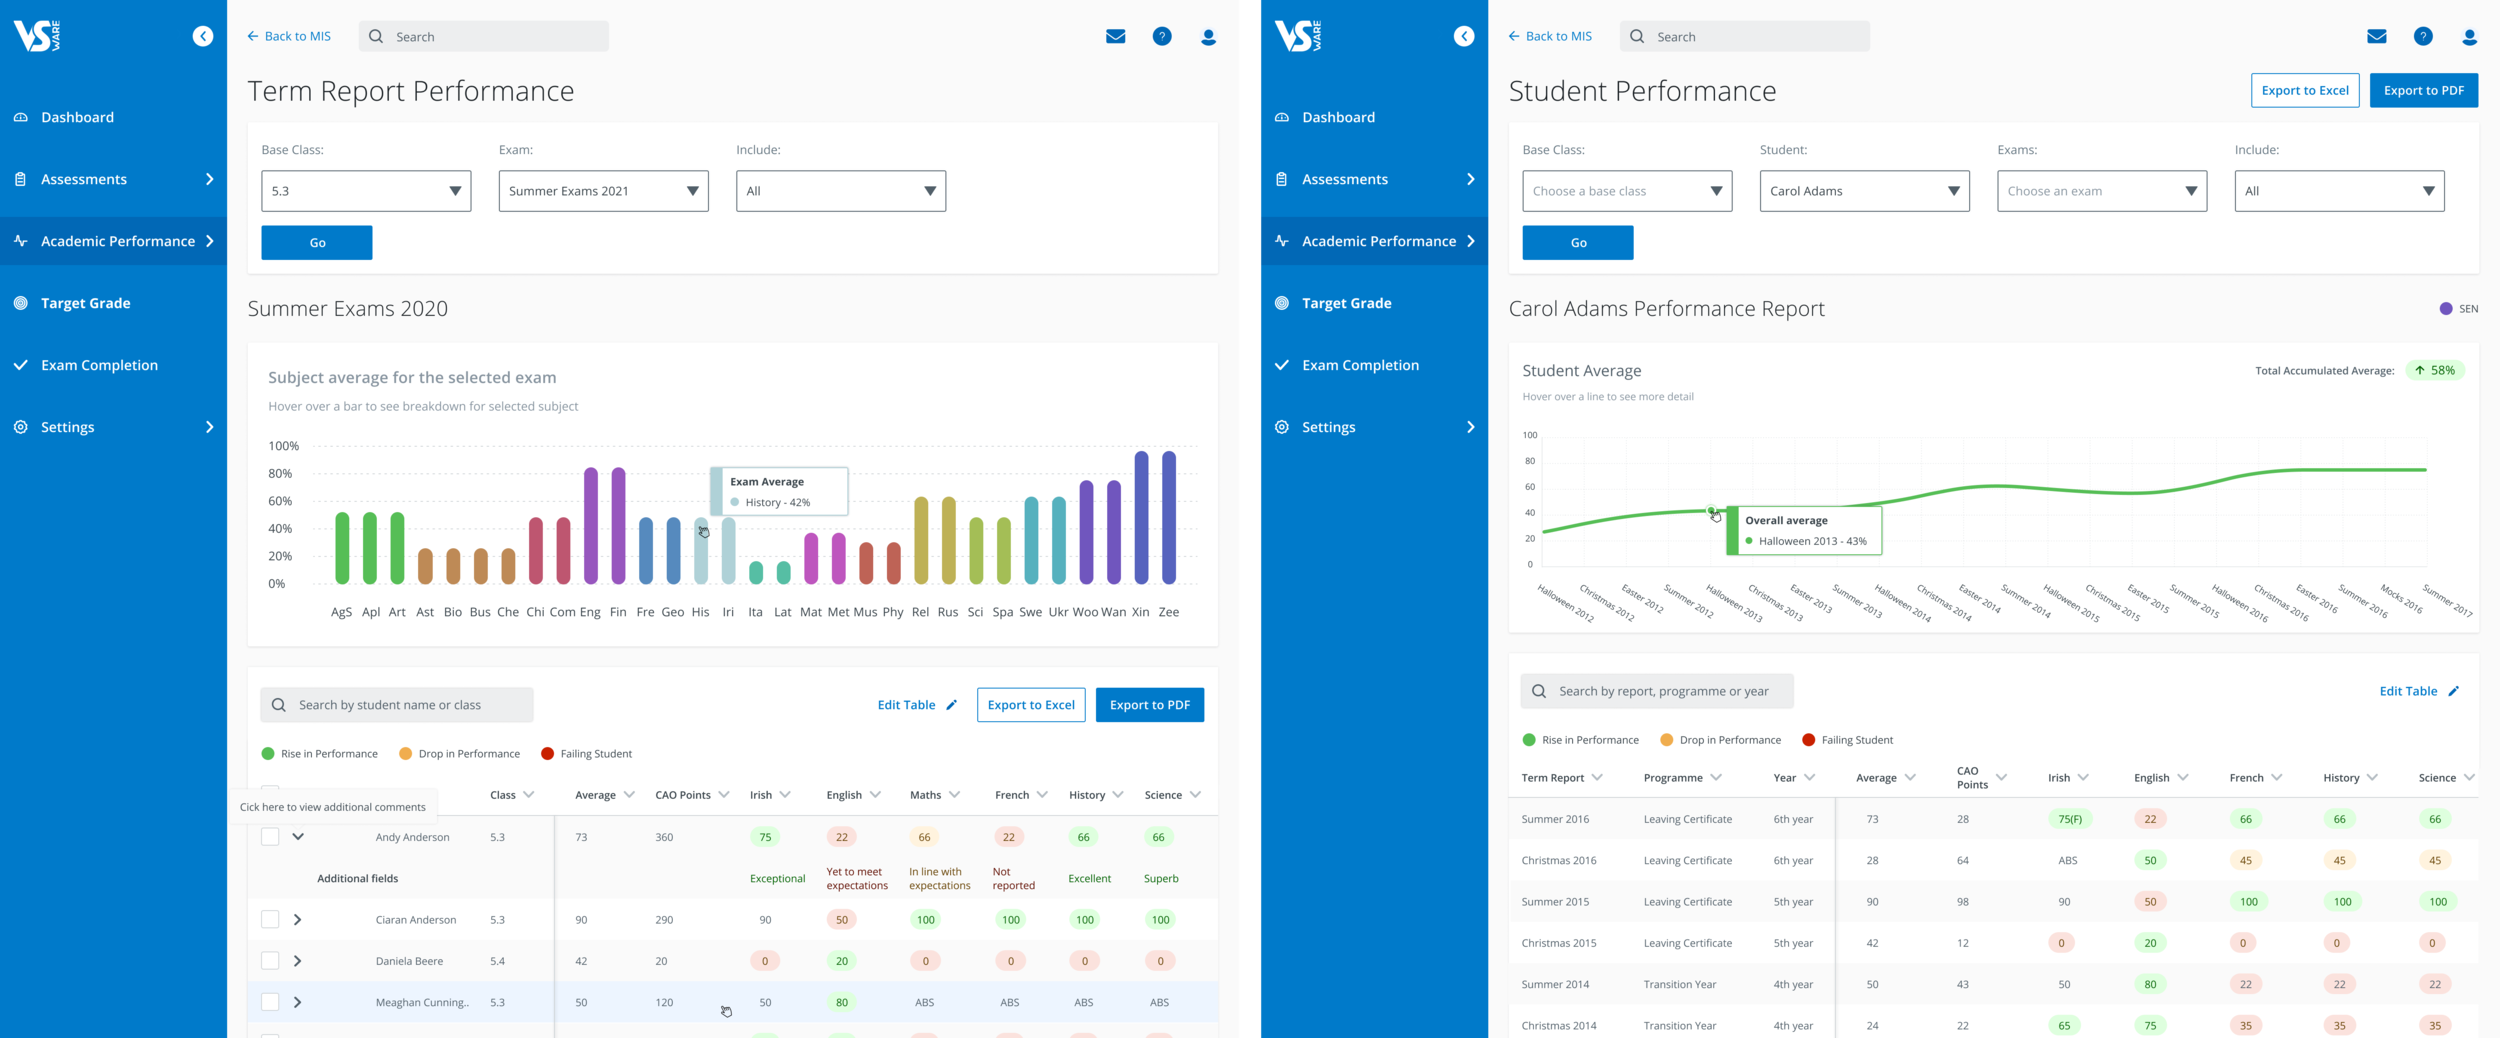
Exam completion helps secretary keep on track of which teachers have submitted their grades or not. The secretary can easily send notifications to remind teachers before they miss the dealines.
We received a lot of requests for graphs and charts. Secretary love being able to understand the information on the page quickly before diving into the raw data. Donut charts were used to display the breakdown of student’s result percentages, line graph were excellent to display a student’s progression and bar charts were ideal for comparing subjects and classes.
While working on assessments, the developers and the designers teamed up to create a fresh new design system. We used the Chakra UI as a foundation which sped up the process so much faster. We created a design system into Storybook in 2 months. Inside the Storybook, the developers could find all the components we designs and extract the code for the frontend. The outcome was a more clean and modern look to VSware, which both developers and designs could use seamlessly.